Vizard 8 » Tutorials & Examples » Vizconnect » Displays and Trackers » Tutorial: Display and Tracker Basics
8.3.1
Vizconnect is Vizard's tool for connecting to hardware devices. This tutorial demonstrates how to use Vizconnect to generate a Vizard configuration file with display and tracker information. For a tutorial that everyone can follow we'll set up a standard monitor display and virtual keyboard tracker. The viewpoint will be linked to the tracker position and orientation to simulate 1st person head tracking. The same steps apply if you're using a HMD and physical tracker.
First create a folder (e.g. Displays and Trackers Tutorial) on your desktop to save the files that will be created in this tutorial.
From the Tools tab in Vizard, select the Vizconnect option. From the Vizconnect Startup page, select option 3 to go to the Advanced Menu. Vizconnect consists of a GUI, where components are added and configured and a graphics window that runs the GUI configuration in real-time. The graphics window updates dynamically as GUI settings change so you can instantly see if your hardware is configured properly.
Try navigating around in the Vizard window and you'll see that it works with the standard mouse controls. At this point we haven't added a display or tracker so Vizard runs the default settings; a mono windowed display and mouse navigation.
From the Displays tab, click Add a New Display to open the display options dialog box. Display options set properties of the graphics window such as field of view and stereo mode. The make, model, and type of each option are shown. Here we'll select the Custom Window option in the generic category. Generic options allow for customizing display properties while Manufacturer options set display properties according to the specifications of a particular hardware model.
Leave the settings at their default and click Apply & Exit. The first thing you'll notice in the graphics window is the viewpoint is fixed at ground level and we can no longer navigate with the mouse. What has happened is we've overridden the default display setting with the custom window. Each display has an associated viewpoint that is initially located at the world origin. In this case, the world origin is at ground level in the center of the Vizard art gallery.
From the Trackers tab, click Add a New Tracker to open the tracker options dialog box. The list contains many physical trackers (e.g PPT, inertia cube) as well as virtual trackers that simulate data using standard devices (e.g. keyboard, joystick, mouse). Select the Mouse and Keyboard Walking option which uses mouse movements for orientation and keyboard arrow keys for position.
Leave the settings at their defaults and click Apply & Exit.
At this point the tracker data has not yet been applied to the viewpoint
so if you move the mouse or press the arrow keys nothing happens in the
graphics window. Still we can see that the tracker is connected by opening
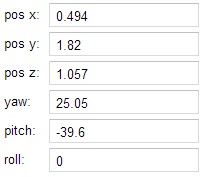
up the Status window ![]() . Check the x y z fields as you press the arrows and the yaw pitch roll fields as you move the mouse. You may notice that the
y position and roll orientation data do not change. That's because this
is a simulated walking tracker that does not accept any input for those
movements.
. Check the x y z fields as you press the arrows and the yaw pitch roll fields as you move the mouse. You may notice that the
y position and roll orientation data do not change. That's because this
is a simulated walking tracker that does not accept any input for those
movements.
Note: The graphics window must have focus for the keyboard to move the virtual tracker.
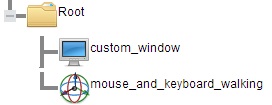
The scene graph tree appears on the right side of the GUI. Each component added through Vizconnect is a node in Vizard's scene graph that can have parent/child hierarchical relationships with other nodes. In these relationships, the child inherits the transforms of the parent. The Root node, or the node at the top of the tree, represents the world origin. The position, orientation, and scale of any object that is a child of the root is in world coordinates. At the moment, this is the case for both the display and tracker:
The hierarchy can be re-organized by dragging/dropping nodes. By making the display a child of the tracker, the display's viewpoint will inherit the tracker's position and orientation.Drag custom_window under mouse_and_keyboard_walking :
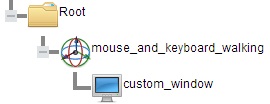
After changing the hierarchy, you should instantly see that the viewpoint is driven by mouse movements and arrow key presses.
Once we've verified everything works in Vizconnect's graphics window, the next step is to import the configuration into our own Vizard application. Click the Save As button in the lower left corner of the GUI, navigate to your tutorial folder on the desktop, and save the configuration as vizconnect_config.py.
Note: The configuration file automatically syncs with the GUI state. In the following sections of this tutorial, it will not be necessary to manually save it again.
From the Vizard editor, create a new script (File > New Vizard File). If you need some desktop space, go ahead and minimize the GUI and its graphics window. We'll be using those more in the next section of this tutorial. Add the following code to the empty script:
The lines above will automatically call viz.go() and open up a Vizard graphics window. In addition they will apply the display and tracking settings we just configured. To see that everything is working add an environment model:
Go to File > Save, navigate to your tutorial folder, and save the script. A descriptive name is suggested (e.g. displays_trackers_tutorial). Run the script and you should see that the configuration settings are loaded with the dojo scene.
Note: For the importing script to find the vizconnect_config.py file, make sure they are in the same folder or the path to the file is specified. If a configuration file is not found, Vizard will run the default windowed display and mouse navigation settings.