Vizard 8 » The Vizard IDE » Running scripts » Debugger
8.3.1
The Vizard debugger supports pausing program execution manually or through breakpoints, stepping through code, and call stack/variable viewing.
Note: The debugger only supports debugging code executed in the main script thread.
The Debug menu has two options for starting the debugger:
Run Debugger: Launches the script and starts the debugger.
Attach to Script: Attaches the debugger to a script that is already running.
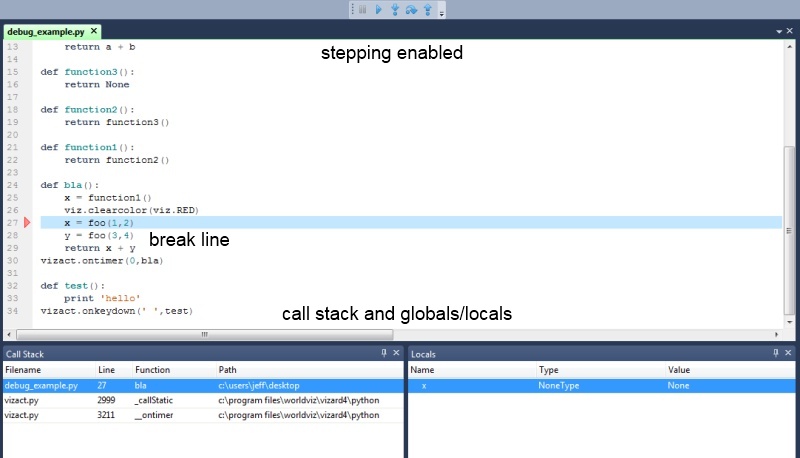
After the debugger has started, the script will run as normal until a breakpoint is met or a break is manually activated. The Debug toolbar, Call Stack pane, and Globals/Locals pane will automatically be made visible for the duration of the debugging session.
![]()
The Breakpoints sub-menu shows options related to setting, clearing, and navigating between breakpoints. This can be found by going to Debug > Breakpoints.
There are two shortcuts for toggling breakpoints. Place the cursor anywhere on the line and:
Right click and select Toggle Breakpoint from the script context menu
Use the Ctrl + F9 keyboard shortcut
Once a breakpoint is set a red triangle will be displayed. This can be done before starting the debugger or while it is running:
When the debugger is active the script will pause execution when a breakpoint is reached or a break is manually activated through the debug toolbar or debug drop-down menu.
You'll notice the following changes in the Vizard IDE when a break occurs:
Continue and stepping options will be enabled in the debug toolbar and drop-down menu
The break line (not yet executed) will appear highlighted in the editor.
Call stack and Globals/Locals panes will get updated.
Code stepping is the process of running a program line by line. The following options are available for pausing/continuing program execution and stepping through code:
 Break:
Pauses execution of the script at the next line of Python code.
Break:
Pauses execution of the script at the next line of Python code.
 Continue:
Continues execution of the script until the next breakpoint is reached
or the Break button is pressed
Continue:
Continues execution of the script until the next breakpoint is reached
or the Break button is pressed
 Step
Into: Steps to the next line in any
scope.
Step
Into: Steps to the next line in any
scope.
 Step
Over: Steps to the next line in the current or parent scope.
Step
Over: Steps to the next line in the current or parent scope.
 Step
Out: Steps out of the current scope
Step
Out: Steps out of the current scope
 Run
To Cursor: Runs the script to the cursor location.
Run
To Cursor: Runs the script to the cursor location.
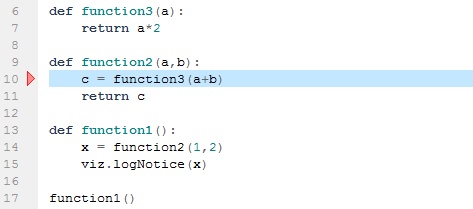
The following code illustrates the effects of using the different stepping commands.
Step Into: the debugger will step into function3 and move to line 7.
Step Over: the debugger will step over function3 and move to line 11, the next line in the current scope.
Step Out: the debugger will step out of function2 and move to line 15, the line after it was called.
Run To Cursor: This option appears in the Debug menu and the script context menu. When the debugger is running, you can right click on any line and select the option. This tells the debugger to continue running up to the cursor location. It's a quick way to run to a specific location without having to step through many lines of code or adding a breakpoint.
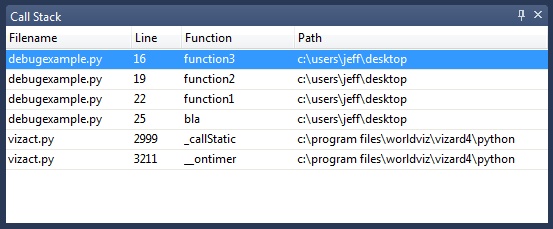
The call stack displays all active functions and from where each one was called. Just as in other stacks, it is organized through pushing and popping. A function is pushed onto the stack once it begins execution and popped off the stack when control returns to the calling location.
The following image shows a number of active functions in the call stack. Since the program has just entered function3, it appears at the top of the stack. Once function3 is complete, it will return control to function2, which in turn will return control to function1 and so on.
Clicking an item in the Call Stack window will move the cursor and highlight the line where control left that function. For example, clicking on the forth entry in the stack, the function bla, will highlight line 25 in the editor. This is the line at which control was passed from bla to function1:
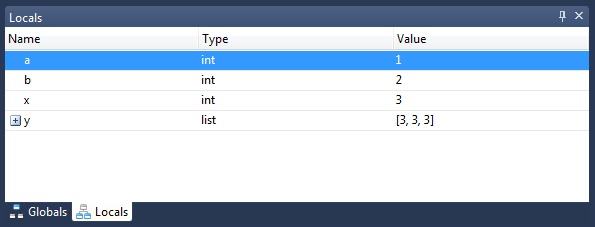
Toggle between viewing local and global objects and their values in this pane:
If a name in the current scope conflicts with an existing name in the
built-in or global scope, then the following warning icon will appear
next to the name: ![]()
For example, if you declared a variable called str in a function, you would see the warning icon next to the name, since it conflicts with the built-in str type:
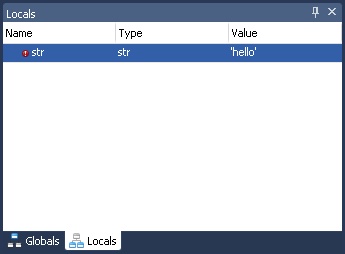
These types of name conflicts can cause subtle bugs that are difficult to track down. If you see this icon while debugging, you should consider renaming the variable so it does not conflict with other existing objects.
Keyboard shortcuts are available for starting/stopping the debugger, setting/clearing breakpoints, and stepping through code.
Running the debugger affects the navigation history as described in the Navigate backward/forward page.